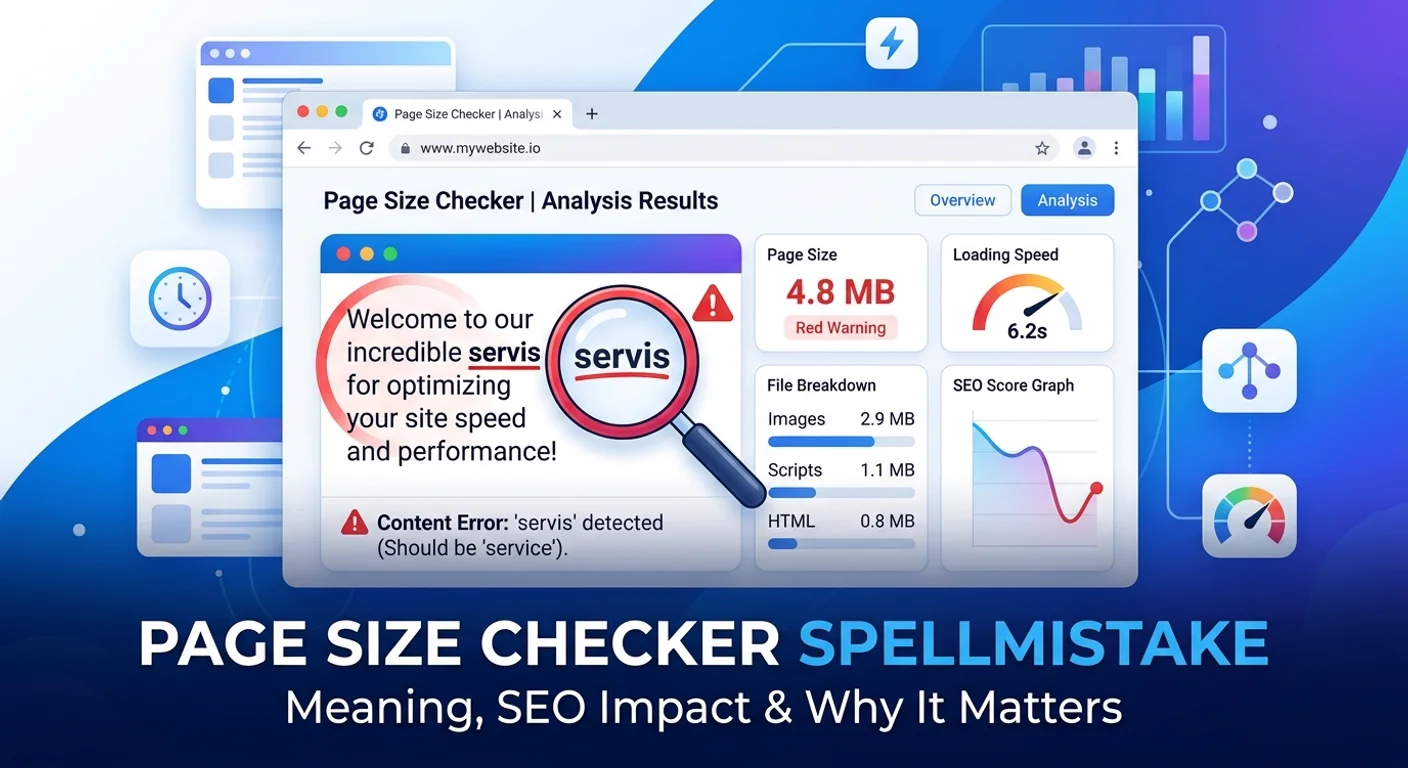
If you've searched for "page size checker spellmistake" or landed here looking for a free tool to measure webpage weight, you're in the right place. This guide explains what page size is, why it's one of the most important technical SEO factors you can control, and how to use a page size checker to diagnose and fix performance problems.
Check Your Page Size Now
Page Size Checker
Measure the total weight of any webpage — HTML, CSS, JavaScript, and Images — to diagnose performance and Core Web Vitals issues.
What Is "Page Size Checker Spellmistake"?
The phrase "page size checker spellmistake" is a search query that refers to the Page Size Checker tool previously popularised by a website called SpellMistake (spellmistake.info). Despite the unusual name, SpellMistake built a suite of simple, no-frills SEO utility tools — and their page size checker became widely used because it was free, fast, and required no sign-up.
Users who discovered the tool there now search for it by combining the tool name with the brand name: "page size checker spellmistake." The FluxToolkit Page Size Checker provides the same core functionality — measuring the total weight of any webpage — with a more detailed breakdown and modern interface.
What Is Page Size?
Page size (also called page weight) is the total amount of data a browser must download to fully render a webpage. It includes:
- The HTML document — the structure of the page
- CSS files — the stylesheets that control layout and appearance
- JavaScript files — the scripts that add interactivity
- Images — photos, icons, illustrations, and SVGs
- Fonts — custom typefaces loaded from Google Fonts, Adobe Fonts, or self-hosted sources
- Third-party scripts — analytics, chat widgets, advertising tags, and social embeds
Every one of these resources must be downloaded, parsed, and processed before a user sees a fully rendered page. The larger the total size, the longer that process takes.
Why Page Size Matters for SEO
Page size directly affects two things Google cares deeply about: user experience and crawl efficiency.
1. Page Speed and Core Web Vitals
Google has used page speed as a ranking signal since 2010. In 2021, Google formalised this with the Core Web Vitals update, which introduced three specific performance metrics:
- Largest Contentful Paint (LCP): How long it takes for the main content to appear. Target: under 2.5 seconds.
- Interaction to Next Paint (INP): How responsive the page is to user input. Target: under 200ms.
- Cumulative Layout Shift (CLS): How stable the layout is as the page loads. Target: under 0.1.
Large pages fail LCP almost by definition. If a user's browser has to download 5 MB of images and JavaScript before the hero image appears, LCP will be 4–6 seconds on a typical mobile connection — a score Google classifies as "Poor."
2. Mobile Performance
More than 60% of global web traffic comes from mobile devices. Mobile connections are slower and less reliable than desktop broadband. A page that loads in 1.5 seconds on a fibre connection may take 8–12 seconds on a 4G connection in a low-signal area. Page size reduction is the single most impactful way to improve mobile performance without changing infrastructure.
3. Crawl Budget
Googlebot has a crawl budget — a limit on how many pages it will fetch from your site in a given time period. For large sites, crawl budget is a real constraint. Large pages take longer to download, which means Googlebot fetches fewer pages per crawl session. Reducing page size can help ensure that all your important pages are crawled and indexed regularly.
4. User Experience and Bounce Rate
Users are impatient. Studies by Google and Deloitte have shown that:
- A 0.1-second improvement in page load time can increase conversions by 8%.
- Pages that load in 1 second have a 3x lower bounce rate than pages that load in 5 seconds.
- 53% of mobile users abandon a page that takes more than 3 seconds to load.
Page size is not the only factor in load time, but it is the most direct one you can control.
What Is a Good Page Size?
There are no absolute rules, but industry benchmarks provide useful targets:
| Page Size | Rating | Notes |
|---|---|---|
| Under 500 KB | Excellent | Achievable for simple pages, blogs, and landing pages |
| 500 KB – 1 MB | Good | Typical for well-optimised content pages |
| 1 MB – 3 MB | Fair | Acceptable for complex pages; worth auditing |
| Over 3 MB | Poor | Likely causing slow load times and poor Core Web Vitals |
| Over 5 MB | Critical | Major performance issues expected on most connections |
The HTTP Archive Web Almanac — which tracks real-world data from millions of websites — reports that the median desktop page weight in 2024 was approximately 2.6 MB, with images accounting for about 45% of that total.
What Makes Pages Too Heavy?
In most cases, oversized pages are caused by a small number of fixable issues:
Unoptimised Images
Images are typically the largest single contributor to page weight. Common mistakes include:
- Uploading 4000×3000px photos when the display size is 800×500px
- Using PNG format for photographs (where JPEG or WebP would be 60–80% smaller)
- Not compressing images before upload
- Loading all images at full resolution on mobile devices
Large JavaScript Bundles
Modern JavaScript frameworks (React, Vue, Angular) can produce large bundles if not configured carefully. Every npm package you install adds weight. Unused code that is included in the bundle — because tree-shaking was not enabled — contributes to size without providing any value.
Render-Blocking Third-Party Scripts
Analytics tags, chat widgets, A/B testing scripts, and advertising code are often loaded synchronously, blocking the browser from rendering the page until the script has downloaded and executed. A single poorly-implemented third-party script can add 200–500 KB and 1–2 seconds to load time.
Unminified CSS and JavaScript
Development versions of CSS and JavaScript files contain whitespace, comments, and readable variable names. Minification removes all of this unnecessary content, reducing file sizes by 20–40% without changing functionality.
How to Use the Page Size Checker
- Enter a URL into the input field. You can use any publicly accessible webpage — your own site, a competitor's page, or any URL you want to audit.
- Click Check. The tool fetches the page from our server and analyses the HTML for linked external assets.
- Review the results. The total page size is shown with a colour-coded rating (Good, Fair, or Heavy). Expand each category (HTML, CSS, JS, Images) to see individual asset URLs and their sizes.
- Identify the largest contributors. Click on each category to see which specific files are the heaviest. These are your highest-priority optimisation targets.
How to Reduce Your Page Size
Once you've identified the problem areas, here are the most effective fixes:
Convert Images to WebP or AVIF
WebP images are typically 25–35% smaller than equivalent JPEGs and 60–70% smaller than PNGs, with no visible quality difference. AVIF is even more efficient but has slightly lower browser support. Both formats are now supported by all modern browsers.
Enable Lazy Loading
The loading="lazy" attribute on <img> and <iframe> tags tells the browser to defer loading those resources until they are near the visible viewport. This reduces the initial page payload to only what the user can currently see.
<img src="hero.webp" loading="lazy" alt="Product image" />
Minify and Bundle Assets
Use a build tool (Next.js, Vite, webpack) to automatically minify CSS and JavaScript in production. Enable code splitting so users only download the JavaScript needed for the current page, not the entire application.
Audit Third-Party Scripts
Open your browser's Network tab and filter by domain. Third-party scripts from analytics, advertising, marketing automation, and chat tools are often the heaviest and slowest assets on the page. Evaluate whether each one is truly necessary and consider loading non-critical scripts asynchronously.
Self-Host Fonts
Loading fonts from Google Fonts adds an extra DNS lookup and network round-trip. Self-hosting fonts and serving them from your own CDN eliminates this latency. Use font-display: swap to prevent fonts from blocking text rendering.
Page Size vs. Transfer Size
One important distinction: page size (the uncompressed size of all assets) is different from transfer size (the actual bytes sent over the network).
Modern web servers use compression — typically gzip or brotli — to compress text-based assets (HTML, CSS, JavaScript) before sending them. A 100 KB JavaScript file might transfer as only 30 KB. The FluxToolkit page size checker measures uncompressed sizes, which is why its numbers may differ from what you see in Chrome DevTools → Network → Size column (which shows compressed transfer sizes).
Both measurements are useful:
- Uncompressed size reflects how much the browser has to process and parse
- Transfer size reflects how much bandwidth is consumed
Related Tools
If you're working on performance and SEO, these tools complement the Page Size Checker:
- Meta Tag Generator — Craft optimised title tags and meta descriptions
- SERP Preview — See how your page appears in Google search results
- Keyword Density Checker — Analyse keyword distribution in your content
- HTTP Header Checker — Inspect caching and compression headers
A fast page and good content are not competing priorities — they are complementary. Use the Page Size Checker as a regular part of your technical SEO workflow, especially after major updates or new feature releases, to catch performance regressions before they affect your rankings.